2014. 6. 17. 20:51ㆍC++
가상 메모리란 실제 윈도우 메모리와 매핑된 4GB 주소 공간으로 이 중 2GB는 Kernel Mode 프로세스가 사용하며,나머지 2GB는 User Mode 프로세스에서 사용하게 됩니다. Kernel 영역은 작업 관리자에서도 확인할 수 있듯이paged pool 영역과 Non-paged pool 영역으로 나뉘게 됩니다. paged pool 영역은 Kernel이 사용하는 메모리 중 디스크에 매핑된 영역으로 300~350MB 까지 사용 가능합니다. 반면, Non-paged pool 영역이란 Kernel이 사용하는 메모리중 RAM 에 있는 영역으로 256MB까지 사용 가능합니다.
이 두 영역에서 발생하는 exception에 대해 알아보면 다음과 같습니다.
Kernel 영역에서 unhandled exception이 발생하게 되면 블루스크린이 나타나게 됩니다. 한편, User 영역에서exception이 발생하면 First Chance Exception이 발생하고, User 영역에서 이 예외 처리를 담당하는 Handler 를 찾게 됩니다. 이때 찾을 수 없다면 Second Chance Exception이 발생하게 되며, Windows OS에서 Handler 를 찾게 됩니다.
추가적으로 메모리 관리에는 다음 세가지 개념이 연관되어 있습니다. Virtual Bytes란 프로세스에서 필요한 메모리를 예약해 놓은 공간이라고 할 수 있습니다. 그리고, Private Bytes란 특정 프로세스에서 commit 한 메모리 공간으로, 실제 프로그램 상에서 1MB를 allocation 한다고 한다면 이는 private bytes의 1MB를 의미합니다. 따라서, 어떤 프로세스에서 메모리 누수가 발생한다고 하면, 이값을 참조하여야 합니다.
마지막으로 Working Set 이란 실제 물리적인 메모리 사용량을 의미하며, 이는 성능 문제가 발생할 때 참고할 수 있는 값입니다.
When you program in a high level language like .NET where the Garbage collector takes care of your memory you do not have to think about memory as often as it is the case in C++. Memory leaks tend to show up much more often in C++ and other non garbage collected languages because nobody is cleaning after you. Garbage collection is a good thing but somehow your application consumes much more memory than you thought it should. What should you do now? First of all you need to understand how your memory is organized by Windows itself. Mark Russinovich has a veryeloquent article about that. If you do not understand what the whole article is all about I give you a quick start.
- Download Process Explorer from TechNet.
Now you see some output like this.
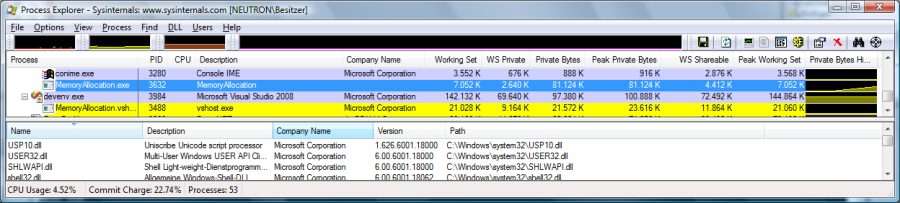
What do the numbers of Working Set, Working Set Private, Private Bytes, ... mean to a "normal" programmer? I do allocate memory, use it and let the garbage collector free it when I no longer use it. The usage of memory is easy but Windows does a lot behind the scenes to make it work in an efficient way. The most crucial part is that Windows does is to share memory between processes when it is read only. Your code and read only data in a dll is a good example of a read only data structure that can be used in many processes. If you use the same dll in more than one process it will be shared between all processes that use it.
Shared Memory
If you look at the columns in the screen shot of Process Explorer you will notice that different counters for Working Set and Private Bytes have been selected. The deeper reason for this is that these numbers are incredibly useful to tune your application. To get more data you can select the Properties (right click on a process) of a process.
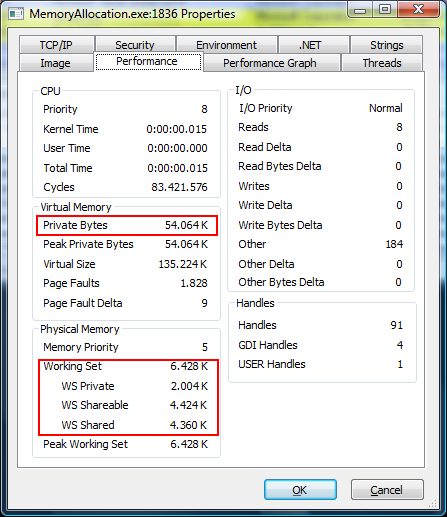
- Working set is the actually used physical memory which cannot be more than the amount of your RAM chips installed on your computer.
- Private Bytes is the memory that cannot be shared between processes.
- Working Set Private tells you how much private bytes attribute to your working set (allocated physical memory) .
When you add the total working set of all processes you can get a much bigger number than the installed memory on your machine. The reason behind this is that much of your process data (e.g. code) can be shared. You can calculate your working set out of
Working Set = Working Set Private + Working Set Shareable
If you want to create a well behaved .NET application you would aim for a low working set and low private bytes. Private bytes are for example all your allocated objects which live on the CLR heap either in Generation 0,1,2 or the Large Object Heap. More about that comes later.
Code Sharing - NGen And Precompiled Assemblies
In the .NET environment things are complicated a bit by the JIT compiler which does compile your IL code into each process separately. To achieve full code sharing in .NET processes you need to precompile your assembly with the NGEN tool to enable cross process code sharing. If you look with process explorer at your loaded dlls (press Ctrl-D in Process Explorer) you will find that all .NET assemblies from Microsoft are precompiled to minimize the memory footprint if more than one .NET process (which is very likely) is runnig. To validate that you are you using the precompiled images look into the Fusion Log (Fuslogvw and check the Native Image checkbox). An even easier way is to look at the path of you loaded dlls. If it does contain C:\Windows\NativeImages_v2.xxxx then you have loaded the precompiled assembly successfully. If not your NGen image did not match the loaded assembly and must be updated or you are using multiple AppDomains. In that case you need to decorate your Main method with LoaderOptimization.MultiDomain value to tell the JIT compiler to share the code between AppDomains.
[LoaderOptimization(LoaderOptimization.MultiDomain)]
static void Main(string[] args)
Code size in enterprise applications can easily reach several hundred MB which would become a major headache if no code sharing between processes is possible.
Data Sharing
Another way to share data between processes are Memory Mapped Files which will be supported by the .NET Framework 4.0 without any PInvokes finally.
Page File Allocated Memory
An even trickier thing is to allocate memory in the page file directly by calling VirtualAllocEx. Since the page file is shared between all processes it is not really possible to attribute this allocation to a specific process (yet). This is the reason why Page File backed memory does not show up as private byte memory at all although your application might consume GBs of it.
Working Set and Allocation Size
There is a very direct relation between Working Set size and allocation size in .NET applications. Try to run the following code snippet
class Program
{
static void Main(string[] args)
{
List<byte[]> memory = new List<byte[]>();
const int Factor = 85; // Allocate 85000 bytes with each loop run
while (true)
{
var bytes = new byte[Factor * 1000];
memory.Add(bytes); // prevent the GC from reclaiming the memory
Thread.Sleep(Factor / 2); // throttle the allocation to make it visible
Console.WriteLine("Next run");
}
}
}
That code snippet will allocate memory in blocks each the size of 85000 bytes and sleep a little to watch the memory allocations more easily. If you wonder why on Earth I did use 85000 bytes as block size: That is the size when the .NET Framework (2.0, 3.0, 3.5, 3.5 SP1) will allocate your object on the Large Object Heap. All objects on this heap are never moved by the Garbage Collector. You can observe this directly when you watch the Working Set Size. It remains constant while you allocate hundreds of MBs of private bytes memory! Windows allocates the memory and finds that since you did not touch the memory it can be moved to the page file where your application will happily allocate more and more page file but not physical memory until you reach the 2 GB limit for a 32 bit process or the page file becomes full.
The effect changes drastically when you change the Factor from 85 to 84. This will change the allocation size below the threshold and you will allocate the memory on the normal CLR heap. That heaps are compacted from time to time by the GC which means that the GC will force Windows to move our memory from the page file into the physical memory. Although our application does not access the allocated bytes the GC will which binds our memory allocation directly to physical memory!
When you allocate memory in smaller chunks than 85000 bytes it will be allocated in your physical RAM due to the GCs nature to traverse the whole heap from time to time.
That is important since it severely limits our ability to run an application with many small objects on machines with not so much RAM. It is therefor vitally important for all .NET developers to track their memory consumption and have a sharp eye on many small (<85000 bytes) object allocations which directly add to the process working set. How and which memory profilers can be used to track typical .NET applications is a topic for a future post.